
Visualizations have become effective tools for understanding complex datasets and finding useful information. Recent advances in data lake services have made it more necessary than ever to ensure good visualization. This article looks at some of the complexities of selecting the right data visualization type for your data services to derive the highest value possible from your data assets.
Significance of Data Visualization
Data visualization is not just about pretty charts and graphs; it’s about converting raw data into actionable insights. By presenting information visually, organizations can better identify patterns and trends, as well as outliers. It promotes informed decision-making for business growth and innovation.
The Role of Data Lake Services
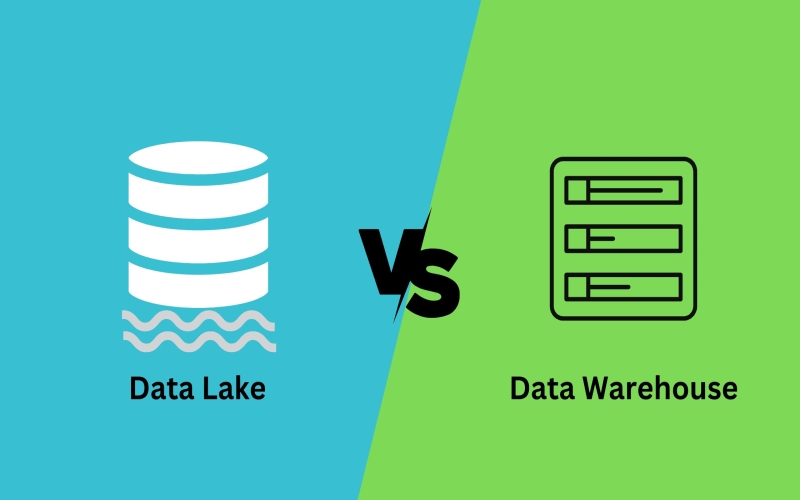
Data lake services are one of the key components in modern data management strategies, which have completely changed how organizations store, process, and analyze their information. Designed for specific types of information, traditional warehouses are structured repositories compared with unprecedentedly flexible and scalable facilities that contain differently formatted data, such as structured, semi-structured, or unstructured ones.
Professional data lake engineering services are meant to be a central repository where huge volumes of raw information from different sources, such as enterprise applications, IoT devices, or social media, can be stored. By allowing ingestion without requiring much preprocessing or schema definition activities, they support capturing extensive amounts of data at low costs while maintaining its original fidelity and granularity.
There is another advantage attached to these services regarding advanced analytics, along with making decisions based on figures obtained from different sources. Once integrated, this single view becomes a unified truth regarding any organization’s landscape when cross-functional analysis occurs through linked sets in such systems; the whole approach towards managing numbers brings up unnoticed relationships between facts that never could have been revealed by analyzing separate datasets.
Challenges in Data Visualization for Data Lake Services
Notwithstanding their scalability and flexibility, the lack of proper visualization poses specific challenges when dealing with Data Lake issues. In conventional ways of looking at it all there are so many more examples represented by set diagrams and other approaches. Furthermore, the absence of data governance and control over data quality in a data lake system can result in accurate and consistent visualizations.
One of the major challenges remains the amount and variety of information stored in such lakes. Traditional visualization techniques may need help handling the size and complexity of these datasets, thus resulting in performance lagging and fewer visualization capabilities. With the accumulation of different types, i.e., structured, semi-structured, and unstructured, institutions need to put their money into sophisticated visualization tools capable of processing and analyzing such huge datasets with ease.
The other problem emanates from a data need for governance and quality assurance within this system. While stringent governance structures guide traditional warehouses, these pools usually operate without centralized governing mechanisms. Hence, discrepancies could arise, leading to distortions and errors during visualization outputs. Given that visualization insights will lose meaning if based on poor data quality, thereby hampering decision-making processes, it becomes crucial to have robust frameworks for managing numbers within such environments. Read more about magazinehub.
Also, challenges exist regarding how dynamic data lakes should be kept fresh and timely. Data lakes receiving continuous feeds of real-time data require visualization solutions to process and visualize near-real-time data sets. Nevertheless, traditional batch processing approaches may need to catch up to the pace at which new data arrives, hence delays and stale insights. In this regard, companies must incorporate flexible ways of visualizing ongoing data and giving immediate answers to users’ queries.
Significant concerns surround the security and privacy of clients’ information with data lake visualization services. As voluminous sensitive and proprietary details are stored within the data lakes, it is important to guarantee the confidentiality and integrity of such information. Inadequate control measures concerning unauthorized access or hacking of the dashboard utilized for visualization can have grave consequences like non-compliance with regulations and harm an organization’s reputation. Consequently, organizations need to focus on securing their information through strong security measures like encryption, access controls, and auditing protocols against visualization assets existing in data lake environments.
Choosing the Right Data Visualization Service Providers
If you choose data visualization service providers who visualize your firm’s data lakes, there are various factors you need to take into consideration. First, ensure that such providers will offer a range of visualization tools depending on what is required for data lakes only. Go for providers with expertise in handling large volumes of datasets by implementing sophisticated algorithms for visualization.
Key Considerations in Selecting Data Visualization Service Providers
Scalability: Pick vendors whose products can be scaled to accommodate the growing quantities of your company’s information stored in a given cloud or shared folder location.
Interoperability: Choose vendors offering solutions that smoothly integrate into existing back-end systems, such as Hadoop or any other analytics platform running parallel with a new big-data storage module.
Customization: Look out for suppliers who allow customers a chance to change some aspects of the dashboards’ layout thus making them more compatible with your type of business.
Data Governance: It is important to ensure that providers adhere to recommended guidelines about data governance to guarantee correctness and dependability in visualization outputs.
Security: Select those vendors that have implemented strong security measures meant to safeguard sensitive information from getting into the wrong hands.
The Evolution of Data Visualization Techniques
In recent times, several developments have occurred in data visualization techniques specifically designed for data lakes. Advanced visualization algorithms like machine learning-based anomaly detection and graph-based data exploration are increasingly employed to draw deeper insights from complex datasets.
Live Data Visualization: The Future of Data Analysis
One of the trends in modern-day visualization services is towards real-time or live visualizations. This implies that, unlike traditional static visuals that are not interactive, users can interactively explore such feeds while receiving them and getting answers immediately. This instant feedback helps make decisions faster and promotes proactive risk management, hence gaining a competitive edge over rivals operating within an ever-changing business environment.
Conclusion
Brickclay provides tailored solutions for data lake visualizations aimed at enabling organizations to extract more value from their data assets. Brickclay has scalable solutions so that different volumes of information can be dealt with, integrates smoothly with current infrastructure, and has customizable dashboards for easy analysis. Furthermore, Brickclay ensures proper observance of data governance and security principles, resulting in reliable visualizations across its clients’ systems. Such expertise provided by Bricklay allows companies to derive maximum benefits from their lake services, thus helping them make informed decisions and achieve growth objectives.