
What many people forget about learning is that it happens in different ways: some people read, some people listen, but others need a visual medium in order to understand what they’re learning. In the skill of building and modeling processes, the visual learner is at an advantage: Diagrams like those used in BPMN 2.0 are a visual medium, through and through. Only by becoming familiar with the elements that make up such a diagram can it prove useful to someone trying to build a business process. BPMN 2.0 is a systematic writing and modeling convention that informs how business processes are meant to look on paper or when represented digitally as a diagram. However, not every user is fully familiar with the elements, the approach, or the reasoning behind BPMN (also known as business process model and notation). So, to make it more useful to those of you who want to model and deploy your own workflows, we have included a guide to understanding these concepts.
The Reasoning Behind It
First and foremost, one has to understand the way that diagrams like this benefit a BPMN user. The overall goal of a model process is to visualize and eventually understand the structure of the process in question: by building a model, a process designer becomes intimately familiar with each individual component that makes up their workflow, real or hypothetical: the activities, such as tasks, the gateways or decision points, and even the events, like the official beginning and end of the process itself.
However, there are other reasons to use BPMN diagrams: one such reason is insight. Much like becoming familiar with the moving parts of a process, a user of BPMN diagrams will also be able to visualize specific insights, such as capacity, flow rate, and in conjunction with these, issues like bottlenecks that can arise. The many things that affect a process design and its performance are visible due to a diagram that properly models and notates the process in question.
All that said, there has to be a way to read it, in order to benefit from the reasons people use such diagrams. Luckily, there’s a very specific standard to the diagrams and how they’re made, which is yet another reason for its existence: it helps to make process visualization a universal language.
Learning The Language
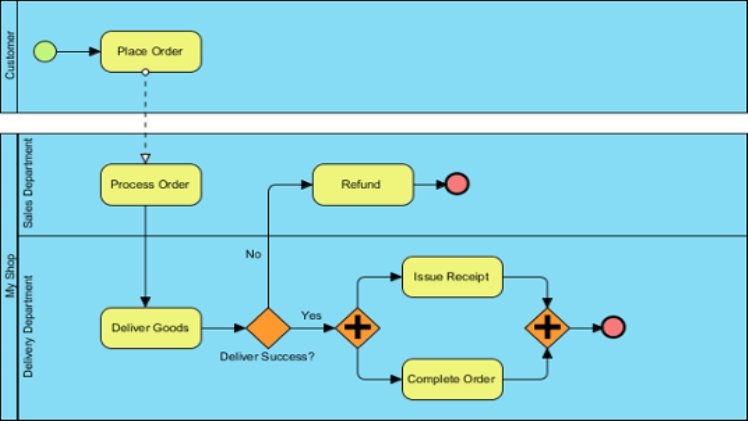
If you’re going to understand and benefit from the use of a BPMN 2.0 diagram, you first have to learn the meaning behind the various BPMN 2.0 symbols used within the models. The first thing to note is that any business process you’ll use reads left to right just like you’re doing right now, and there’s an arrow which always flows in that direction to guide you along the diagram. As for the other symbols, there is a method to the madness concerning all the various elements used.
Events
While there is always at least one event for the start of the process and one symbolizing the end, there are numerous reasons why an event could be present within a BPMN diagram. Events are often either milestones or triggers, and though they all appear in the shape of a circle, the ones that have more specific conditions (like a specific passage of time or process errors) bound to them show up with an array of coded symbols within each circle. BPMN 2.0 symbols are especially complex in this arena, as there are a plethora of things that could trigger an event, or that could become a triggering event within your process.
Activities
Another important element — truly the most important element — within any process is the activity. Activities are the building blocks of processes, and some are actually subprocesses of their own, while others are singular tasks. A task, in and of itself, is the most basic of these, as it’s characterized by one job, a singular measurement of work, being completed. While labels for events appear below the symbols, activities are rounded rectangles with the label inside, always an action of some kind, like “writing book” or “cooking pizza”. Whatever the activity is, it’s where the work happens, and that’s what defines the overall process; every activity has an input and output of its own, just like the main process itself.
Gateways
Think about it like this: if you see a diamond, there’s a decision to make. Gateways, or decision points, are the places in a business process where something forces a decision: it can be an either/or decision, otherwise known as an exclusive gateway, or it can be an inclusive gateway that allows multiple paths to be taken after the decision is made. Either way, you’ll recognize them for yet another characteristic: they always wind up diverging or converging paths, making gateways the place where some workloads end or continue in full swing.
Making Sense Of It All
While there are other elements that are less important (like lanes and symbols representing the use of data), the general sense of the path a process takes begins to make more sense once you understand activities, events, and gateways. In addition to that, though, you have to contextualize the symbols and their meanings to the process that’s taking place: whether it’s a library checkout or a complex software development workflow, there’s a process taking place — by beginning to make sense of that real-life process, will you start to see how each BPMN element fits in.